I opted for a Fitbit because they say “your data belongs to you”. But as it turns out, it is no easy task getting access to my own data from their main website where users have their personal accounts. Their data export feature is extremely limited and no way to download raw data. (By “raw data” I mean the numbers that I can use to do my own analysis and graphing.) Fitbit only provides data summaries and basic visualization. And currently, I don’t even see a way to extract my heart rate data, which really shouldn’t be that difficult for them to provide access.
I ended up spending a considerable amount of time messing around in the Fitbit API website. So I’ve decided to put together a step-by-step tutorial on how to get your data. And as a bonus, I’ll provide codes to generate heart rate time-course graph (like the ones in the last couple of posts). This requires no prior programming or scripting skills, but this assumes you’re a Fitbit user. And you will also have to be a bit adventurous and get comfortable using scripts to interact with your computer instead of the usual point-and-click with a mouse. This may be novel to some, but worry not. It’s easy!
(Note: Fitbit seems to keep changing their access protocol. This is the most up to date as of October 2017)
Setting up authorization in the Fitbit API
To get started, you’ll have to go to the Fitbit API, create an account, and pretend that you’re developing an application.
- In main page go to Tools > “Register web app” and create an account
- In the web registration step (Figure 1), enter the following information:
- Application name and description (whatever comes to mind)
- In application website and organization website, I entered https://github.com/ (some enter google.com)
- For “OAuth 2.0 Application Type” make sure to select personal and make the callback URL “https://www.google.com/”
- Select read&write and then click Register
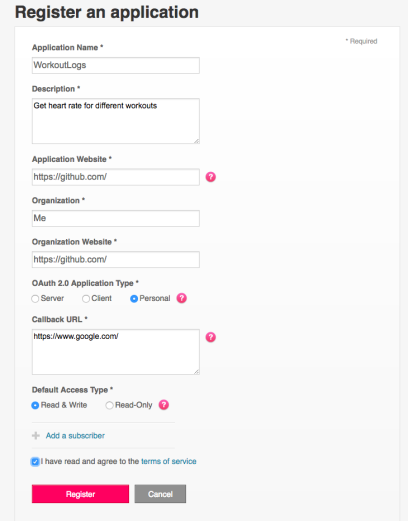
Figure 1
- The above steps will create an application page with Client ID and Client Secret (Figure 2). Then click on the “OAuth 2.0 tutorial page”
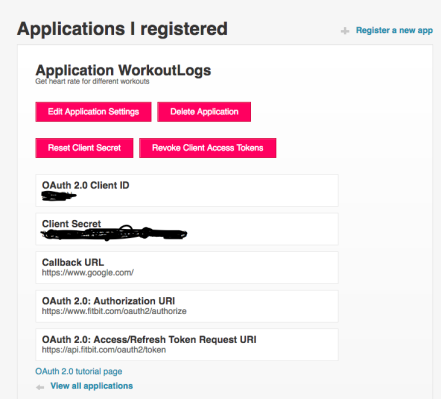
Figure 2 - The first thing you need to do in the authorization page is to set up the type of authorization
- Choose “Implicit grant flow” and choose the data you want access (I select all) and then click on the URL at the bottom.
- This will open a new tab (Figure 3); select all and then click “Allow”, and this will take you to a Google page (i.e, your callback URL).
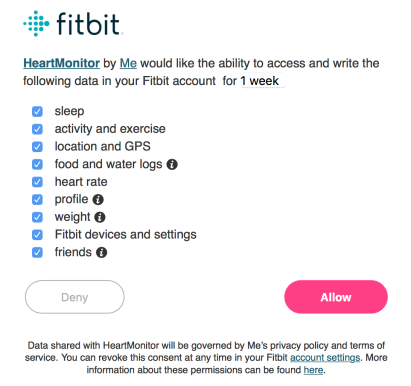
Figure 3 - Next will be “2: Parse response”. From the newly opened Google site, select the full web address and copy and paste it to the box under “Parse response”. This step will generate an authorization token for you (Figure 4).
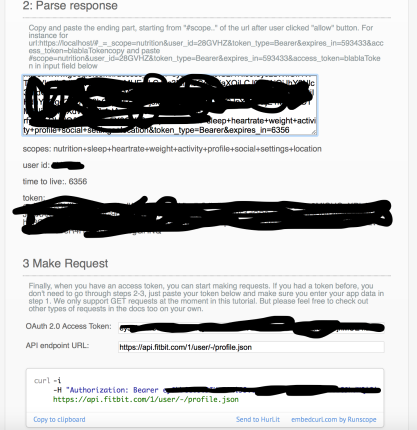
Figure 4
Getting your data!
Ok, so here is where I deviate a bit from the standard way provided by Fitbit. Fitbit uses a cURL command, which is basically a command line tool to download stuff from websites. A user may simply click on “send to hurlit” (Figure 4) and the website will run that command on your behalf. Then you’ll have to convince them that you’re not a robot, then they’ll give you the data via the web browser, then you’ll have to tediously copy and paste. Not efficient and not the best way to go about, in my opinion. But if you’d rather point-and-click, then sure. But I prefer using the command line.
[If you’re a Mac user, the command line is in Go > Applications > Utililies > Terminal and this will open the inbuilt Unix terminal. For a Windows user… er… ask someone. 🙂
In the terminal, enter the following code below. Let me break down the specifics of this. The “curl -i -H” is the function call to download data. Within quotes you enter your token that was parsed for you in step 4 above (like so… “Authorization: Bearer yedieyefi007yeyeverylonggibberish”). The code below is asking for heart data, from date 2017-10-07, at 1 minute resolution (which effectively is heart beats per minute) and from 8:45 AM to 10:15 AM (%H:%M format). Obviously you’ll need to set your own date and time according to your preference. [this code is longish and you can place your mouse on the code window and scroll right]
curl -i -H "Authorization: Bearer enter-your-token-here" https://api.fitbit.com/1/user/-/activities/heart/date/2017-10-07/1d/1min/time/08:45/10:15.json > mydata.json
This command is specifically to get heart rate. If you want other types of data, like your sleep, the parameters for this request can be found here.
This then saves the data as a simple text file named “mydata.json” to your computer. The data inside is in a format called json. You can open this file with any text editor to see what’s inside. Yay! But yes, Fitbit gives you the data as a json format instead of simple rows and columns that you can easily copy and paste to an excel file.
Saving your data to excel and plotting on R
Brief R tutorial.
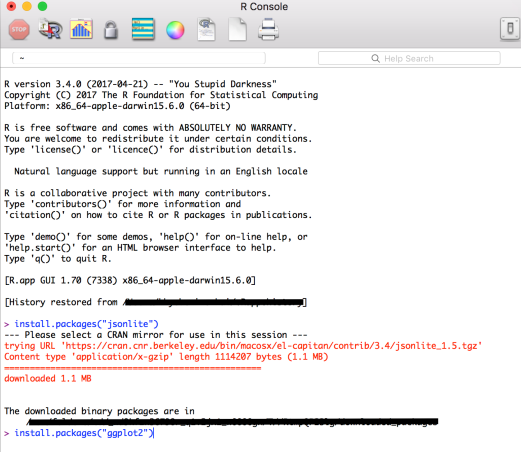
What it R? R is a computer language and also an interface (sort of like your Unix or DOS terminal) where you can do all kinds of stuff! Go to https://www.r-project.org and install the latest version of R. Then open the R window and install the following packages: (1) jsonlite, (2) ggplot2. Installing a package is very easy. Type in: install.packages(“package name”) (Figure 5).
I will assume that the “mydata.json” file is in your home directory. You can move it to a different folder if you like, and when you open your R session, navigate to that folder. For example, if you moved mydata.json to a folder on your desktop named “MyFitbit”, in R simple type the “set working director” code:
setwd("~/Desktop/MyFitBit")
Then copy and paste the code below [this code is also long so again, place your mouse on the code window and scroll]:
library(jsonlite) ##loads jsonlite to your current session##
library(ggplot2) ##loads ggplot2 to your current session##
d <− file("mydata.json", "r") ###connecting to file; "r" mode is open to read in text mode##
d2 <- readLines(d)
d3 <- fromJSON(d2[16]) ####relevant line is #16, read that in ##
hr <- d3$"activities-heart-intraday"$dataset ##and convert to dataframe##
dim(hr)
write.csv(hr, "mydata.csv")###optional, if you want to save the data so you can open in excel##
hr$Min <- seq.int(nrow(hr)) #adds a column with minutes of workout##
head(hr) ##take a peek at data##
uplimmin <- max(hr$Min)
tiff("MydataGraph.tiff", width=10, height=8, units="in", res=600, pointsize=16)
ggplot(hr, aes(x=Min, y=value, color=value)) + geom_line() + geom_point(size=0.8) + scale_y_continuous(name="Heart rate (bpm)", limits=c(40, 200), breaks=seq(40, 200, by=10)) + scale_x_continuous(name="Time (minutes)", limits=c(min(hr$Min),max(hr$Min)), breaks=seq(0, uplimmin, by=10)) + scale_color_gradient2(name="Heart rate (bpm)", low= "#DBB165", mid="#2E604A", high="#D1362F", midpoint=120) + ggtitle("My heart rate (customize title)") + theme(axis.text=element_text(size=14), axis.title=element_text(size=16,face="bold"), plot.title=element_text(size = 16, face = "bold"))
dev.off()
The ggplot code looks complicated (on line #13). Let me break it down so you can customize if you want:
- scale_y_continuous(name=”Heart rate (bpm)”, limits=c(40, 200), breaks=seq(40, 200, by=10)): Here I’ve set the scale from 40 bpm to 200, you can changes those numbers
- scale_color_gradient2(name=”Heart rate (bpm)”, low= “#DBB165″, mid=”#2E604A”, high=”#D1362F”, midpoint=120): I used those hex color codes; you can change them, or even simply writing “red”, “blue”, “black” will work
- ggtitle(“My heart rate (customize title)”): this sets the title for the graph. Name it anything you want.
[Update on 19 Oct 2017: quick note of code line #5, the “d3 <- fromJSON(d2[16]”). The [16] is because my json data has 14 lines of header information followed by one empty line and the actual data starts only at line 16. Someone alerted me that their data started on a different line. So yours may be different. The best thing to do is to open the file in a text editor (e.g., Mac’s TextEdit or Textwrangler) and see which line, as in which row, the data starts in your file and change the number in fromJSON(d2[16]. The line that data starts will look something like this {“activities-heart”:…. etc.]
This will create a tiff file with your graph and the file name will be “MydataGraph.tiff“, but you can name it what you want in the code above (in tiff(“gobbledygook.tiff”…)).
There we go.
[please excuse typos and errors; not proofread and author makes lots of typos]

Hello, I tried to follow your directions, but when I clicked on the url in Step 4 I got the following:
“The app you’re trying to connect did not provide valid information to Fitbit. Please report this issue to them. Developer information: unauthorized_client – The client is not authorized to request an access token using this method.”
Do you know how to fix this?
LikeLiked by 1 person
Sorry to hear that. Not sure how to resolve “unauthorized client”. Did you select “personal” in the registration and “implicit grant flow” in the “Authorize” page? If you’ve not already resolved it, this might help https://community.fitbit.com/t5/Web-API-Development/unauthorized-client-The-client-is-not-authorized/td-p/1648947
LikeLike
Do you have code for pulling interday data, rather than intraday data?
LikeLike
For other types of data, you can get the specific parameters here and adapt. https://dev.fitbit.com/reference/web-api/heart-rate/#get-heart-rate-time-series
On the left menu, you’ll see options for sleep, food, etc.
So by inspecting the syntax they provide here, the interday code would look something like (example, data from October 7 to 8):
curl -i -H “Authorization: Bearer YourSecretAccessTokenHere” https://api.fitbit.com/1/user/-/activities/heart/date/2017-10-07/2017-10-08.json > test.json
LikeLike
Thanks so much!
LikeLike
For Windows Powershell I made a script that generates an array of dates as strings in the format on FitBit’s servers, and then retrieves all the files according to the date listed in the array. Removing the -i switch from and adding -O to the cURL line makes the json files easier to manage. Then in R I had to combine all those jsons into a data frame…after a bit of manipulation it was doable.
The only caution is that you are limited to 150 requests per hour, meaning 150 json files per hour. In the top information in the json (when you leave in -i), it will show you how many seconds you have until the quota is reset, or if you exceed, how long until you can resume retrieving the files.
The Powershell script was easy enough (using Calorie intake for this example, as I was looking for the simple total number each day:
# Construct a date array as the json files on FitBit’s center is (usually) organized by date
$datey = [datetime]’2018-01-01′ #Starting Date
$datearr = do
{
$datey.ToString(‘yyyy-MM-dd’)
$datey = $datey.AddDays(1)
}
until ($datey -gt [datetime]’2018-05-15′) #Ending Date
#Then execute the download using the special Auth token. Add -i to keep server response. -O downloads original file, -H passes Auth token to header (required)
foreach ($i in $datearr)
{
$exstr = “curl -O -H “”Authorization [token]””https://api.fitbit.com/1/user/-/foods/log/caloriesIn/date/$($i)/$($i).json”
iex $exstr
}
The json content is simply: {“foods-log-caloriesIn”:[{“dateTime”:”2018-02-27″,”value”:”2297″}]}
LikeLiked by 1 person
Hi, hoping you will respond, will you be able to share your Powershell script? I am looking to grab my heart rate data on a monthly basis and a PS script would really be helpful. 🙂
LikeLike
Thanks for your guide! I am on the last step “Getting Data”, and when I enter the curl command I get the error “curl: (1) Protocol “https” not supported or disabled in libcurl”. Do you know what I need to do to fix this?
LikeLike
FYI for those who also have this problem. I ended up adding the path to curl.exe to my system path variable and that seemed to fix the problem.
LikeLiked by 1 person
Thanks much for the fix! Sorry that I couldn’t respond. Was traveling and now catching up on work!
LikeLike
This is great, but does not go far enough. I get HR by the second from a downloaded TCX, but this only gives me by the minute. I am actually trying to get cadence, but steps in a minute is all I can get from the API and it isn’t in the TCX.
Not blaming you of course, but Fitbit
LikeLiked by 1 person
Sorry for not seeing your comment. Got busy with work and forgot about this! 😛 I believe you have the option of get HR by second… I just used per minute as I wanted beats per minute.
LikeLike
Great introduction. I really like squirrels =)
I think without it, I would not be able to find out how to get my data.
I want to add a few things:
1.) Google as a URL did not work for me. I used my own web-page to get the url
2.) Windows user can not use cURL in the command shell. To use it, they should download the cURL package from here: http://www.confusedbycode.com/curl/
3.) Windows 10 users can not simply download the files with ” > mydata.json” because, in this case windows will try to save the data where the shell is running. The access there will be denied. So as a windows user you should try to use something like this: C:\>curl -i -H “Authorization: Bearer mylongBearer” https://api.fitbit.com/1/user/-/activities/heart/date/2018-03-15/1d/1min/time/00:00/23:59.json >C:\temp\mydata20180315.json
Best regards,
Sebastian
LikeLiked by 1 person
Found out some maybe helpful things – I found that when you remove the -i switch from the curl command. -i will remove all the informational junk lines, leaving you with just the data in the json file, so you won’t have to search for the right line number.
When you add -O and remove the “> mydata.json”, this will simply direct download the json file on the fitbit server and place it on your computer with the original filename. I had do this when downloading calorie data because for some reason, when running this cURL command in Windows (Powershell works great), the file it generated using the “> mydata.json” command was unreadable by R, even though it looked like straight text through any viewer.
I have no idea why this happened (and would appreciate any tips to get the > desiredfilename.json working correctly), but the -O workaround was good enough for me to download all my calorie-intake data, analyze, and realize how off I truly have been! 🙂
LikeLiked by 1 person
Thank you SO much for these clear and detailed directions
LikeLike
Hi! Thanks, this is really helpful! However, I’m getting into a problem that I’m not sure how to fix. I’m trying to do this multiple times in a row to extract heart rate data from a few different Fitbits. If I try to do this back to back on different Fitbit accounts, I get an error after trying to click on the authorization URL. The error is “The app you’re trying to connect did not provide valid information to Fitbit. Please report this issue to them.
Developer information: unauthorized_client – The client is not authorized to request an access token using this method.” Any ideas about what causes this and any potential fixes?
Thanks!
LikeLike
Hi, I’ve moved away from Fitbit so become quite unfamiliar. Another person had the same problem (conservation above with Ben from Oct 2017). I hope you’re able to resolve it. Good luck!
LikeLike
Ok, thanks anyways!
LikeLike
[…] Your heart, your calories, your sleep, your data: How to extract your Fitbit data and make graphs us… […]
LikeLike
[…] From the outset, I’ll say that Oura has done a spectacular job making it very easy for us users to export our own daily summary data. Some, probably most, companies are not very good at that. As comparison, I have used a Fitbit, and currently use a Garmin. Garmin makes it relatively easy to export the daily “activities” summary. But when it comes to health summaries (e.g., stuff like average heart rate, minimum/maximum heart rate, calories etc.), it’s like pulling teeth (Garmin users, correct me if I’m wrong). I’ve written about this issue I faced with Fitbit in the past. […]
LikeLike